Note
Go to the end to download the full example code.
Colour & label customisation
Colours
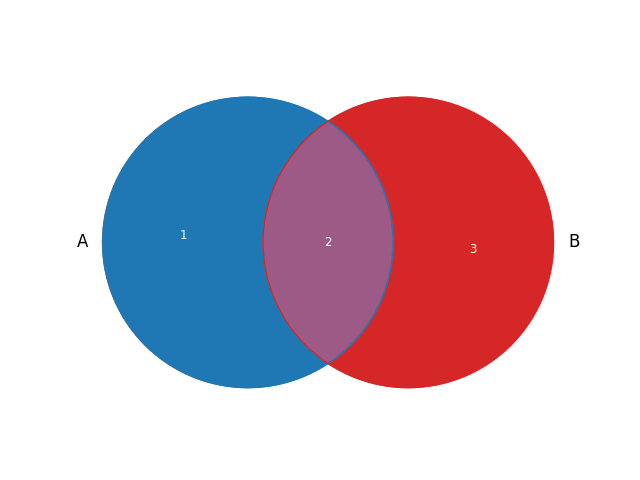
The primary way to specify set colours is through the set_colors argument.
Each subset is then coloured by blending the colours of the corresponding super-sets.
import numpy as np
import matplotlib.pyplot as plt

from matplotlib_set_diagrams import (
    VennDiagram,
)

subset_sizes = {
    (1, 0) : 1,
    (1, 1) : 2,
    (0, 1) : 3,
}
set_colors = ["tab:blue", "tab:red"]

VennDiagram(subset_sizes, set_colors=set_colors)

plt.show()

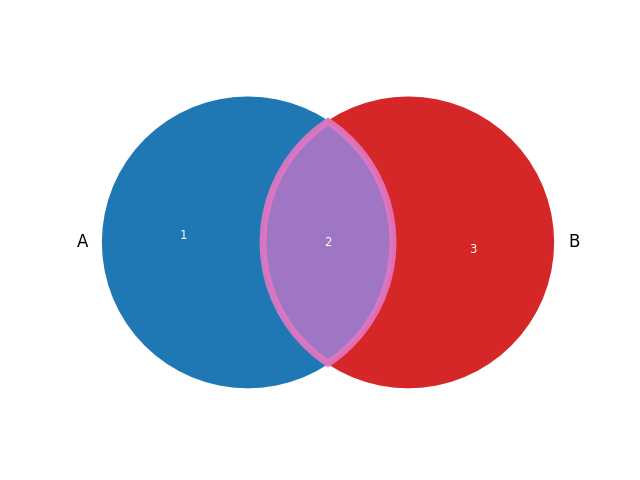
To change the colour of a subset independently of the set colors,
access the corresponding matplotlib Polygon artist,
and use the standard matplotlib methods.
fig, ax = plt.subplots()
diagram = VennDiagram(subset_sizes, set_colors=set_colors, ax=ax)
artist = diagram.subset_artists[(1, 1)]
artist.set_facecolor("tab:purple")
artist.set_edgecolor("tab:pink")
artist.set_linewidth(5)
artist.set_alpha(0.9)
plt.show()
The outlines of the sets are invisible by default.
To show them, access the corresponding matplotlib Circle artists,
and set their visibility to True.
fig, ax = plt.subplots()
diagram = VennDiagram(subset_sizes, set_colors=set_colors, ax=ax)
for artist in diagram.set_artists:
    artist.set_visible(True)
plt.show()
The set artists can be styled using the standard matplotlib methods.
fig, ax = plt.subplots()
diagram = VennDiagram(subset_sizes, set_colors=set_colors, ax=ax)
for artist in diagram.set_artists:
    artist.set_visible(True)
    artist.set_edgecolor("#2c404c") # off-black
    artist.set_linewidth(0.5)
plt.show()

Labels
By default, sets are labelled using the letters of the alphabet,
and subsets are annotated with their size (as in the examples above).
Set labels can be set explicitly using the set_labels argument,
subset labels by providing a subset_labels argument:
sets = [{"rhombus", "square"}, {"square", "rectangle"}]
set_labels = ["equilateral", "rectangular"]
subset_labels = {
    (1, 0) : "rhombus",
    (1, 1) : "square",
    (0, 1) : "rectangle",
}
VennDiagram.from_sets(sets, set_labels=set_labels, subset_labels=subset_labels)
plt.show()

If the subset labels are a function of the subset ID and/or subset size,
the subset_label_formatter can be used to specify the subset label.
For example, to label subsets with the percentage of the total, use the following:
subset_sizes = {
    (1, 0) : 1,
    (1, 1) : 2,
    (0, 1) : 3,
}
total_size = np.sum(list(subset_sizes.values()))

def formatter(subset_id, subset_size):
    return f"{subset_size / total_size * 100 : .1f}%"

VennDiagram(subset_sizes, subset_label_formatter=formatter)
plt.show()

Finally, the set label “artists” and subset labels “artists” are just
matplotlib Text objects, which can be manipulated directly using the
standard matplotlib text object methods:
set_labels = ["Lorem", "ipsum"]
set_colors = ["tab:blue", "tab:red"]
subset_sizes = {
    (1, 0) : 1,
    (1, 1) : 2,
    (0, 1) : 3,
}
diagram = VennDiagram(subset_sizes, set_labels=set_labels, set_colors=set_colors)

# manipulate text objects using standard matplotlib methods:
font_weights = ["light", "bold"]
for ii, text in enumerate(diagram.set_label_artists):
    text.set_color(set_colors[ii])
    text.set_weight(font_weights[ii])

for subset_id, size in subset_sizes.items():
    text = diagram.subset_label_artists[subset_id]
    text.set_fontsize(10 * size)

plt.show()

Total running time of the script: (0 minutes 0.292 seconds)